Event Connection Health delivers enhanced visibility, control, and adaptability for developers
Event Connection Health is the first release in an upcoming series of features that give data teams more visibility and control over all their customer data with one integration. Developers can now save engineering hours by quickly troubleshooting most connection issues without having to open a support ticket.
When you bring your car into the shop, there are a number of signals the mechanic can use to diagnose and source the problem. The dashboard alone has lights that can point to the battery, cooling fluid, oil pressure, tires, brake system, traction, engine, and other common culprits of car troubles. These indicators significantly narrow the scope of the issue, and allow the mechanic to more quickly diagnose and address the problem. Now imagine if your car had no such sensors. The source of the issue would be much more difficult to pin down, and resolving it would take much longer than it should. All too often, this is the situation in which developers tasked with integrating software products find themselves, and it is never an experience we want engineers who implement mParticle to have.
Our commitment to the developer experience
Before marketers and product managers can leverage a CDP to do exciting things like create audiences and predictive ML models, the first step is to simply ingest data from your apps, and verify that this data is being properly forwarded to your downstream tools. This critical step rests entirely on the shoulders of developers. This is why we are committed to delivering products and features that create an exceptional developer experience––like a clear and comprehensive onboarding experience, intuitive documentation, guided tutorials, API reference guides, SDKs in all popular languages and frameworks, and most importantly, transparency and troubleshooting tools that give developers flexibility and control over their data.
We will continue to release features that enable developers to integrate once, and connect their data anywhere on the industry’s most adaptable platform. To get things started, we’re excited to announce the launch of Event Connection Health––a new feature that will give developers more transparency and control over their data connections. By surfacing actionable, minute-by-minute insights into the health of your data connections, Event Connection Health will greatly empower engineers to identify, diagnose, and correct data errors on their own, without having to open a support ticket.
Let’s dive in!
Streamline your website integrations
Learn which third-party integrations you could replace with a single SDK by adopting mParticle.

No time-consuming guesswork or manual QA
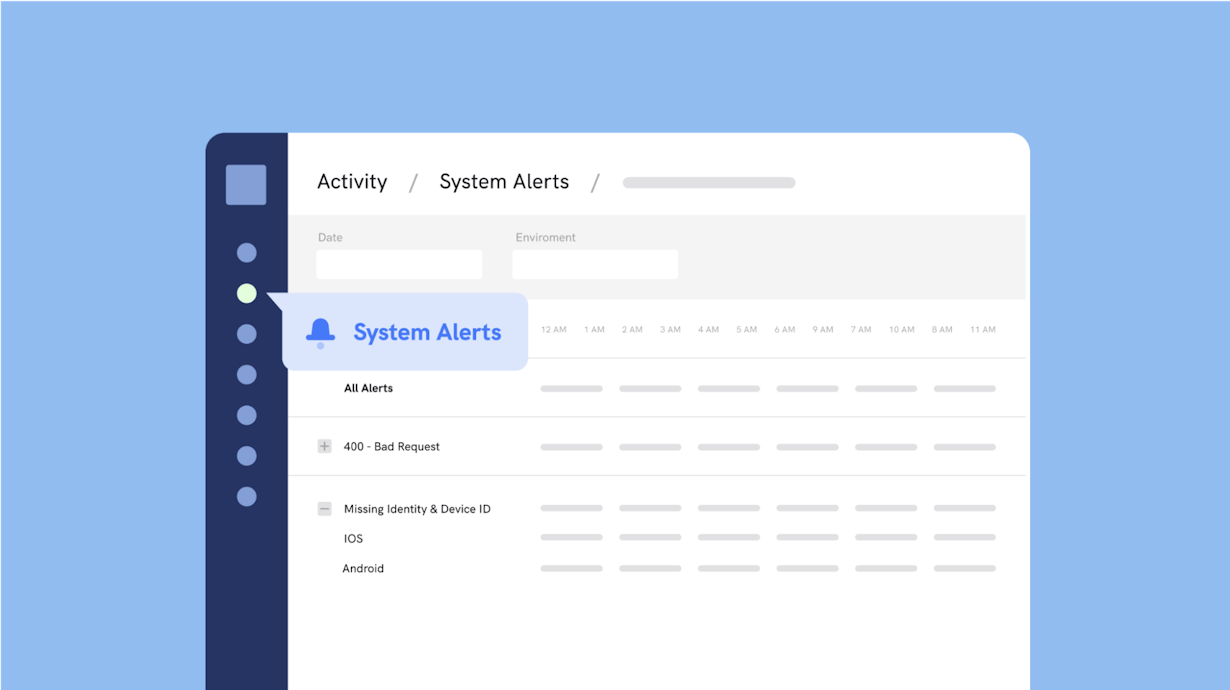
System integrations are one of the biggest potential sources of issues within your data stack. Since integrations involve data moving between multiple systems, it can be particularly difficult to identify the source of errors originating within data connections. mParticle Event Connection Health is an enhancement to the System Alerts dashboard that gives users the ability to evaluate their event connections at a glance and troubleshoot issues on their own without having to speak to an mParticle employee.
View your data connection health at a glance
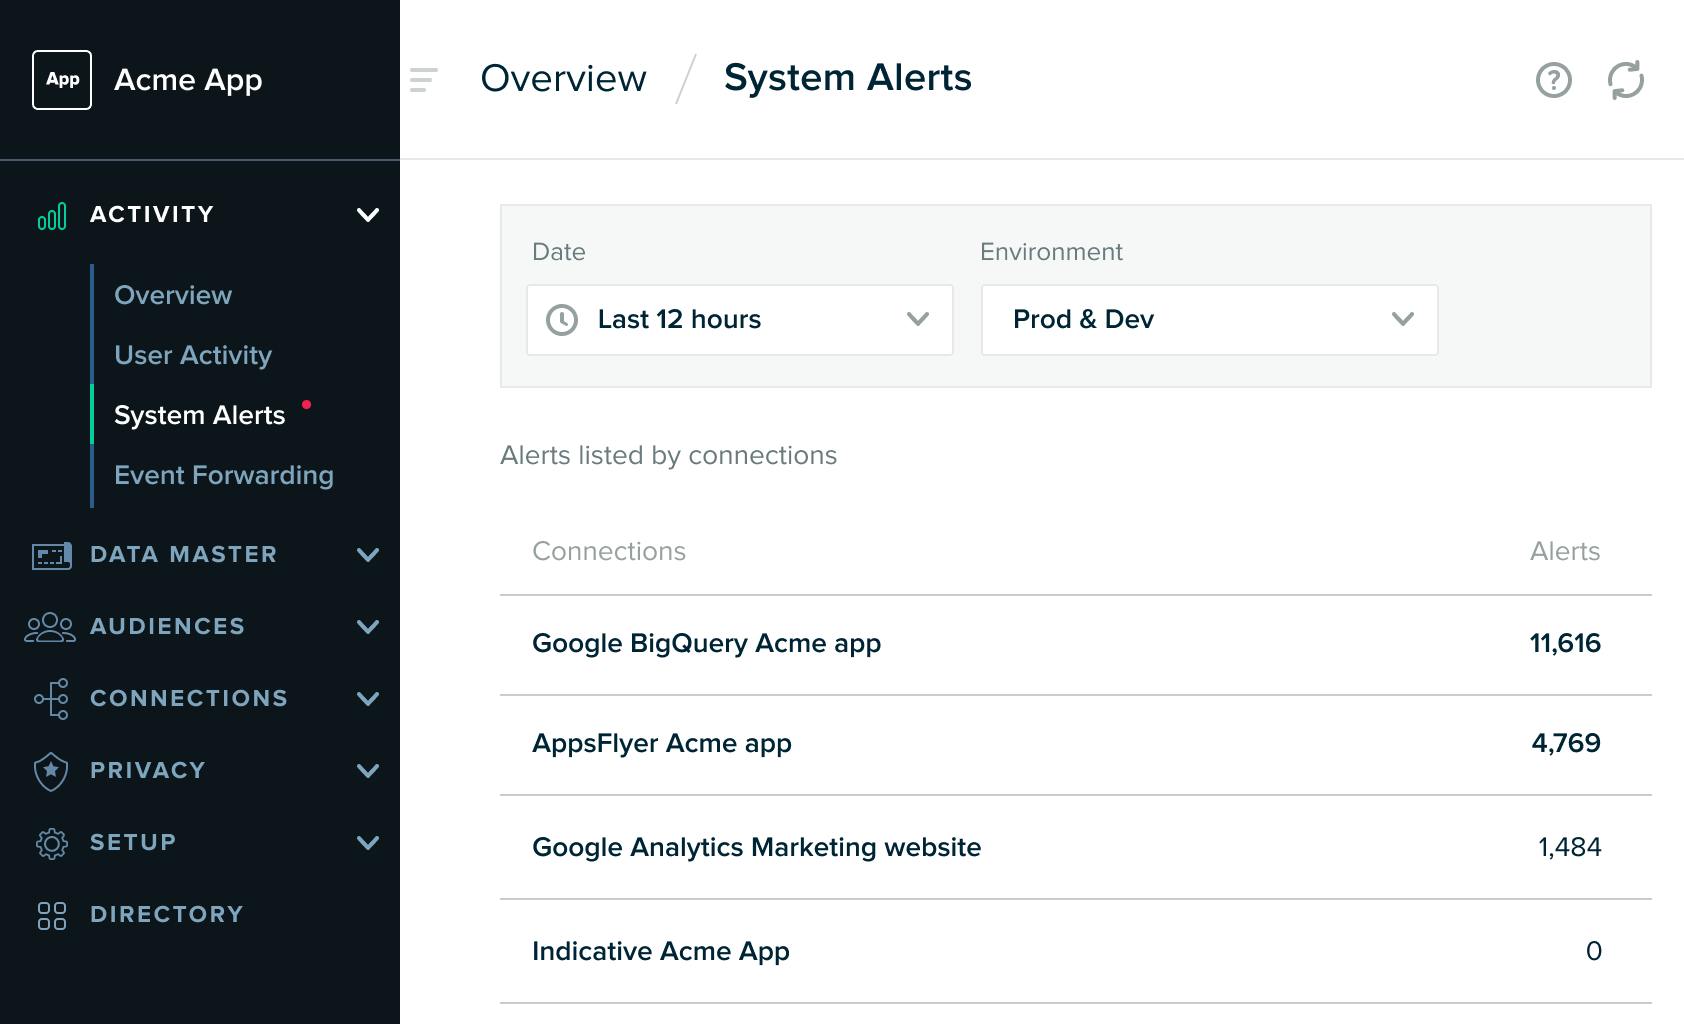
Event Connections Health provides transparency into your data connections at two levels, so developers can quickly identify and prioritize any problematic systems at a glance, then drill into specific connections as necessary. First, the main dashboard within the System Alerts section of the mParticle UI displays event alert data at the level of your Connections, which consist of an input, an output, and the configuration information that determines how data should be shared between the two. Here, we see total alerts collected for each connection we have set up:
See a granular, by-the-hour view of your alerts
From here, you can drill deeper into the problem by viewing your alerts at the level of individual connections. This view breaks out alerts by type and input, and displays them along an hourly timeline within a date range that you select. Looking at the alerts that have surfaced specifically within the “Google BigQuery Acme app” connection, we can quickly identify that there is an issue with missing identities and device IDs from our iOS input:
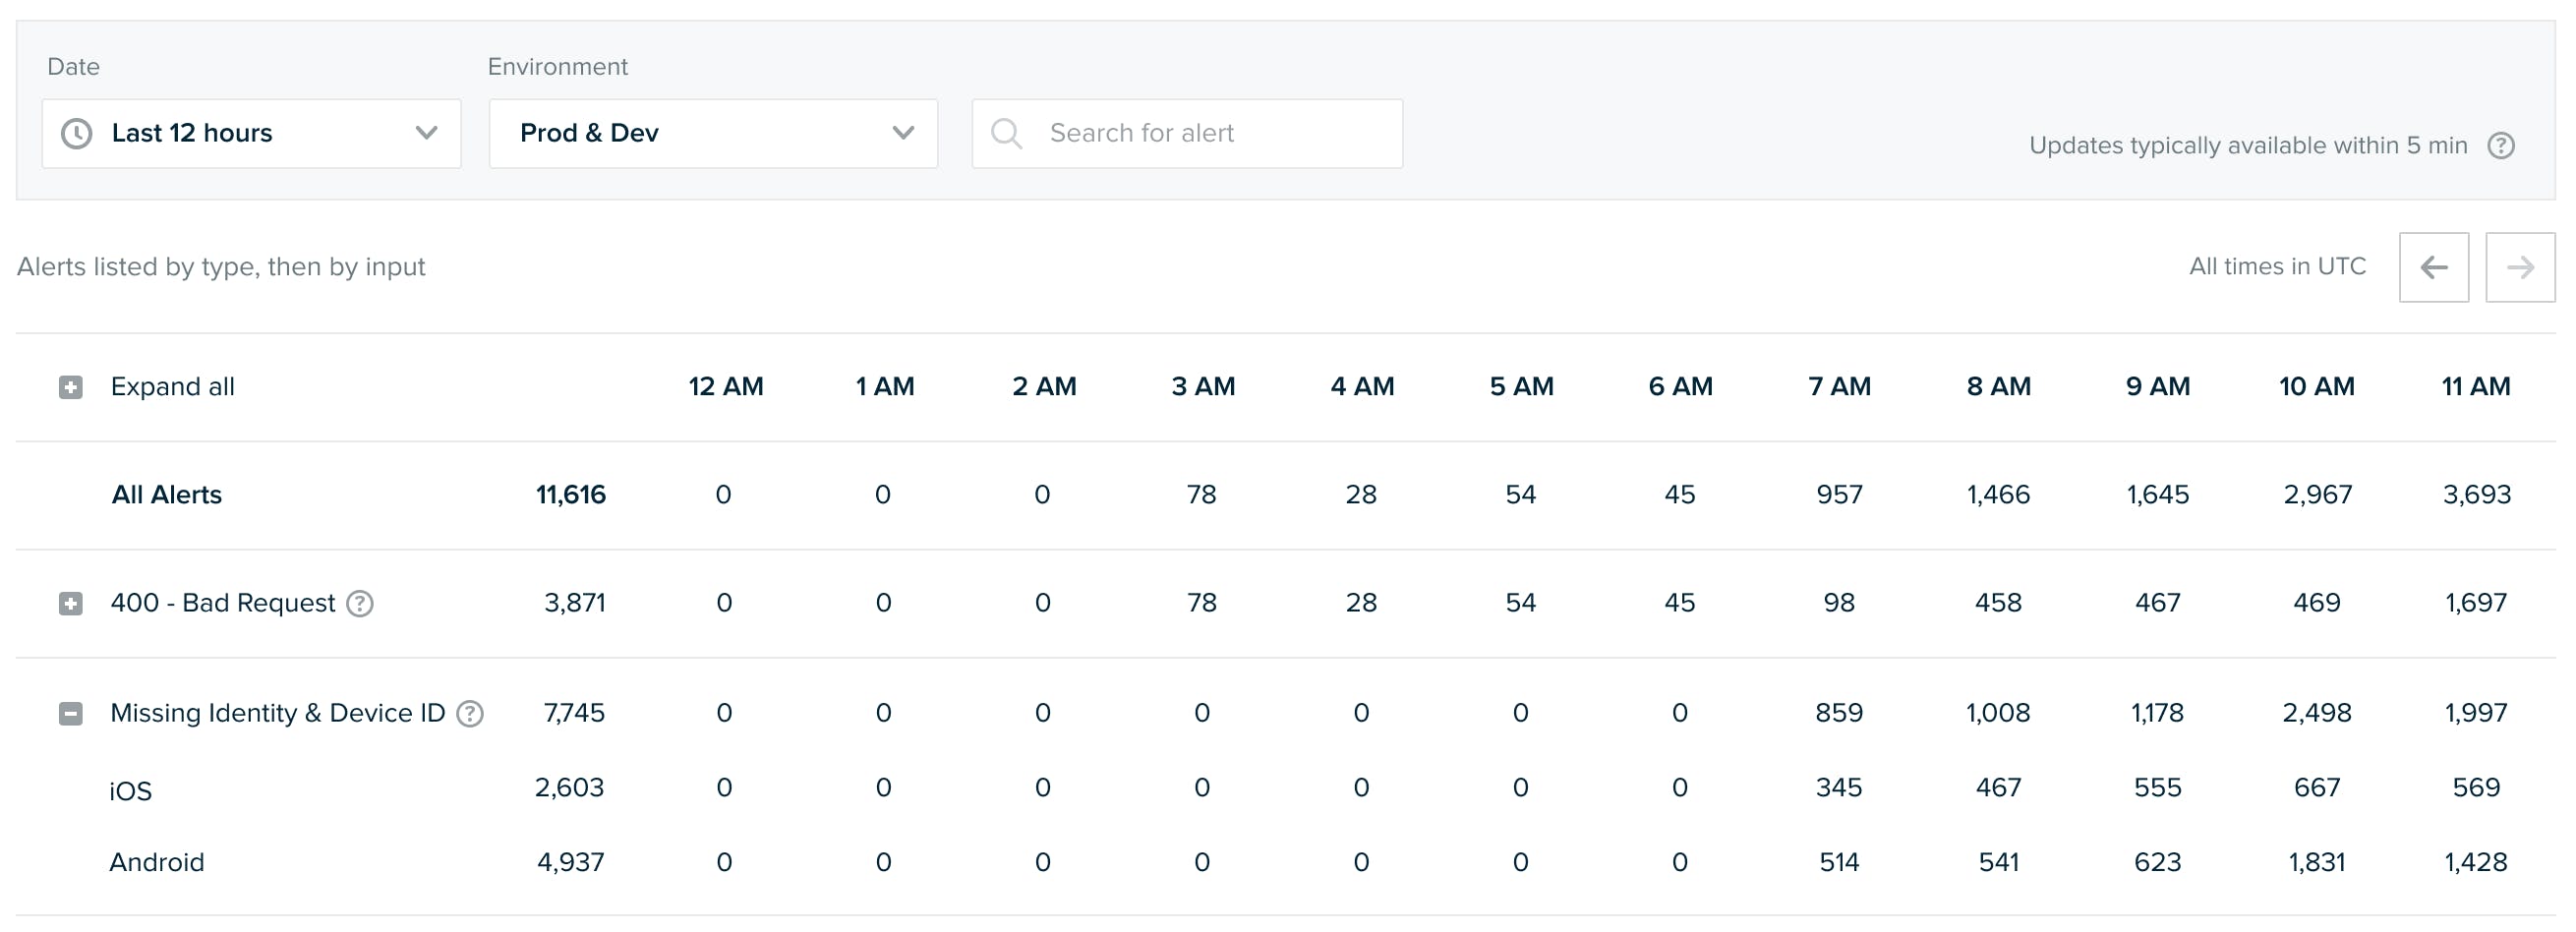
In this example, we were able to gain actionable insights into the health of our data connections quickly and accurately, without having to contact a solutions engineer. We can now focus our troubleshooting efforts on the source of the problem, and resolve this issue before it compromises data quality throughout our pipelines.
Coming soon: An Enhanced Usage Limits Dashboard for greater control and transparency into your product usage
Event Connection Heath is just the first step in a series of new releases aimed at giving developers enhanced visibility and control over their CDP. Our next feature release centered on this theme will be our Enhanced Usage Limits Dashboard––a new user interface feature that will give developers quick and easy visibility into their mParticle usage, and the ability to see how close they are to their current data limits at any given time.
Clear and simple usage monitoring will help engineers in a number of ways. Most obviously, since usage can be one of the primary drivers of cost, this feature will make it easy to contain costs. Additionally, tracking usagage anomalies can also tip developers off to data connection problems originating within a source system. And finally, clearer visibility into product usage within the mParticle UI will mean more ability to troubleshoot issues without the need to open a support ticket or contact a representative.
We will provide a closer look into the Enhanced Usage Limits Dashboard when the product is released––stay tuned!
Visit our docs for more information about System Alerts.
